Stephen Morgan
EMAT 6680 Assignment 1
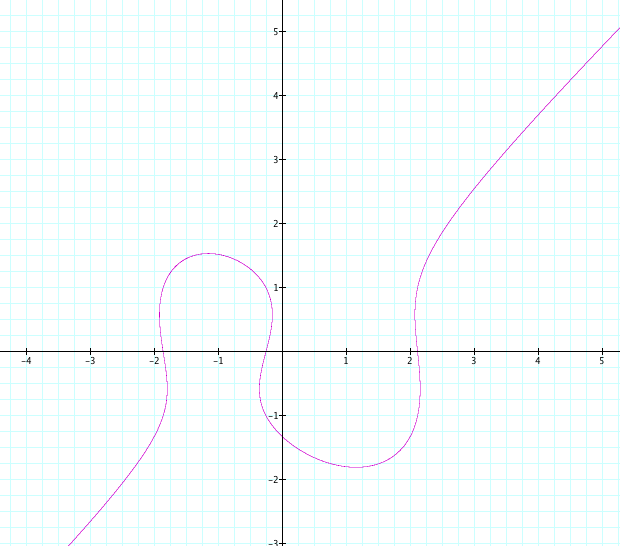
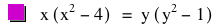
I chose to do problem one for this write up. The first part of the write up asks us to examine the graph of the equation below. Then it askes us to see what happens if we replace 4 with other numbers and interpret our findings.

In the first graph nothing substainal of note is observed. We do see that there are three roots for the equation
at (-2, 0), (0, 0), and (2, 0). We also can see there is a relative maximum at (-1, 5/3) and minimum at (1, -5/3).
As x approaches negative infinity the limit of the function approaches negative infinity and as x approaches
infinity the limit of the function approaches infinity.
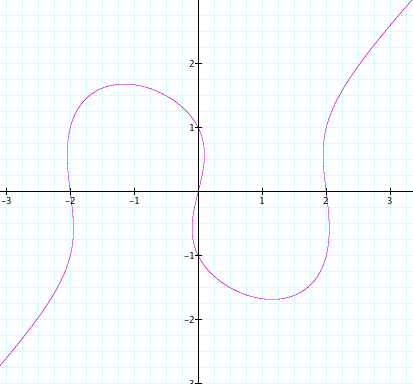
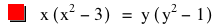
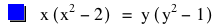
The next thing I did was replace 4 with the integers 3, 2, and 1. We see that not much of note occurs when we substitute in 3 and 2.
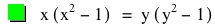
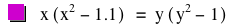
The curved areas of the graph become compressed. However when we substitute in 1 we generate an ellipse which is of particular interest.
We can see from observing the graph that even though the green line contains the points (-1, 0), (1, 0), (0, -1), and (0, 1) it is not the graph of a circle.
Even though we can see algebracially if we manipulate the equation of the green line, we do not produce the equation of a circle, it's interesting to ask why
this is the case. It would also be interesting to delve into ellipses and circles and see what the geometric and algebraic differences are and to understand the differences
at a deeper, semantic level.
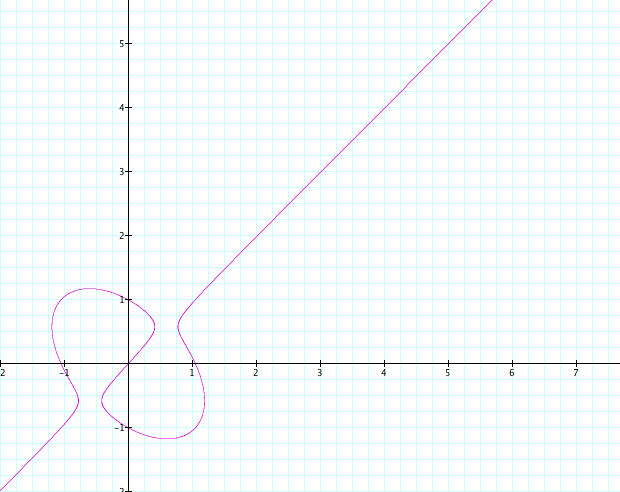
Next I replaced 4 with 1.1 We can see the curved areas are converging but nothing else significant of note seems to be occuring here.
The ends of the lines representing the function apply to be linear instead of curved though, which may be of significance.
Again, I decided to look at the graph where we replace 4 with 1. This is mainly to serve as a reference so we can see how the graph changes when we use 0.9 instead of 1.1.
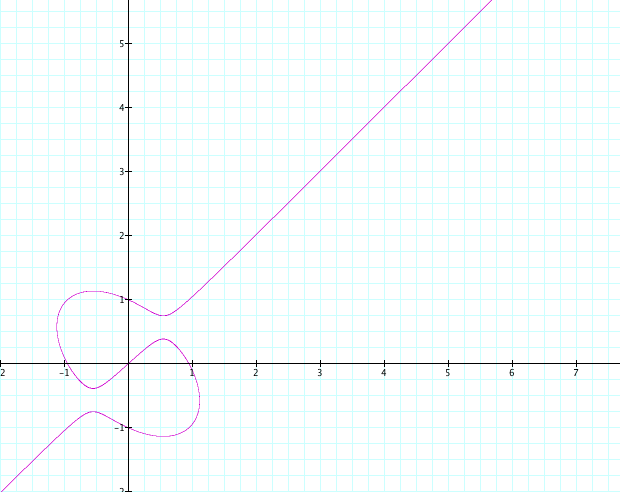
When we input 0.9 the orientation of the curved areas of the graph changes, but everything else remains the same.
I expect this to continue until we have a value of 0 or less then 0 substituted for 4. This will produce the line of a common cubic equation.
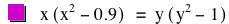
Here we do replace 4 with (-3) a value that is less then 0. And we produce the graph of a general cubic.
Even though we can show that this is algebraically true, why is this the case. What is significant about values 0 and values smaller then 0?
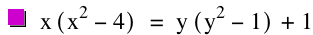
Next we are asked to find the equation of the following graph below:
This immediately is interesting. While it has three roots, which is common to a cubic, the sizes of the two curved areas are not the same!
Why? Also how do we go about generating this equation? Obviously it has three roots and we know they are approxiametely at (-1.8, 0), (-0.8, 0), and (2.2, 0).
There is also a y-intercept near (0, -1.7). Where do we go from here?
The first thing I thought about doing was adding a constant to our equation. I thought this would shift the graph over as desired. However, it also accounted for the curve below. By adding 1 to the right side of our equation we generate the desired result: